# 组件说明
# 描述
来源于 wx-charts (opens new window),基于 canvas 绘制,体积小巧。

浏览器或调试器扫码可体验图表组件示例。
# 支持的图表类型
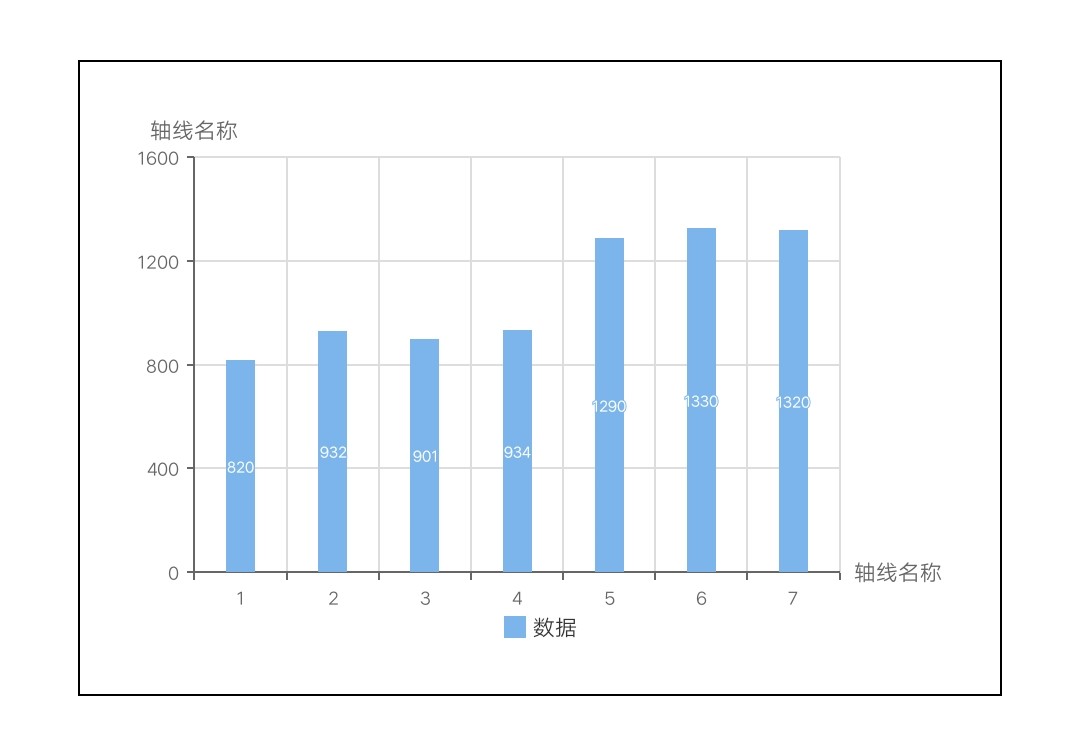
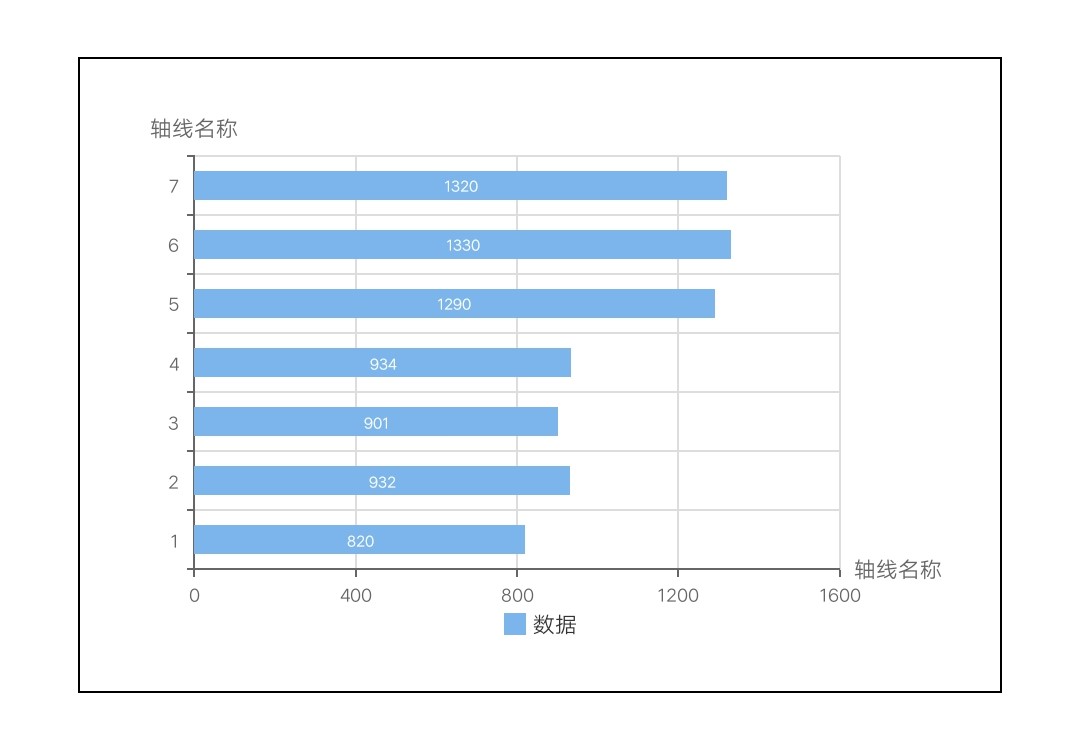
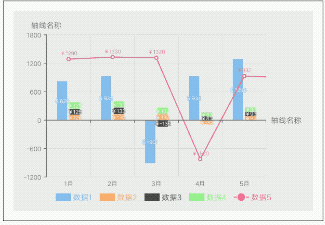
- 柱状图 bar
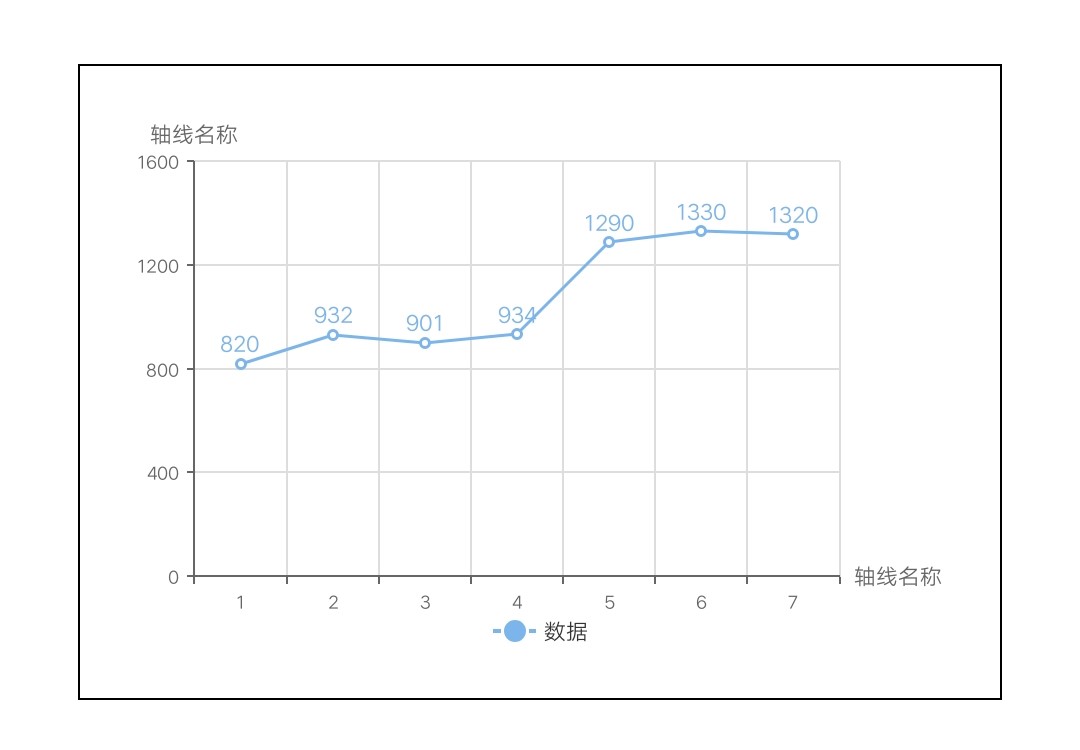
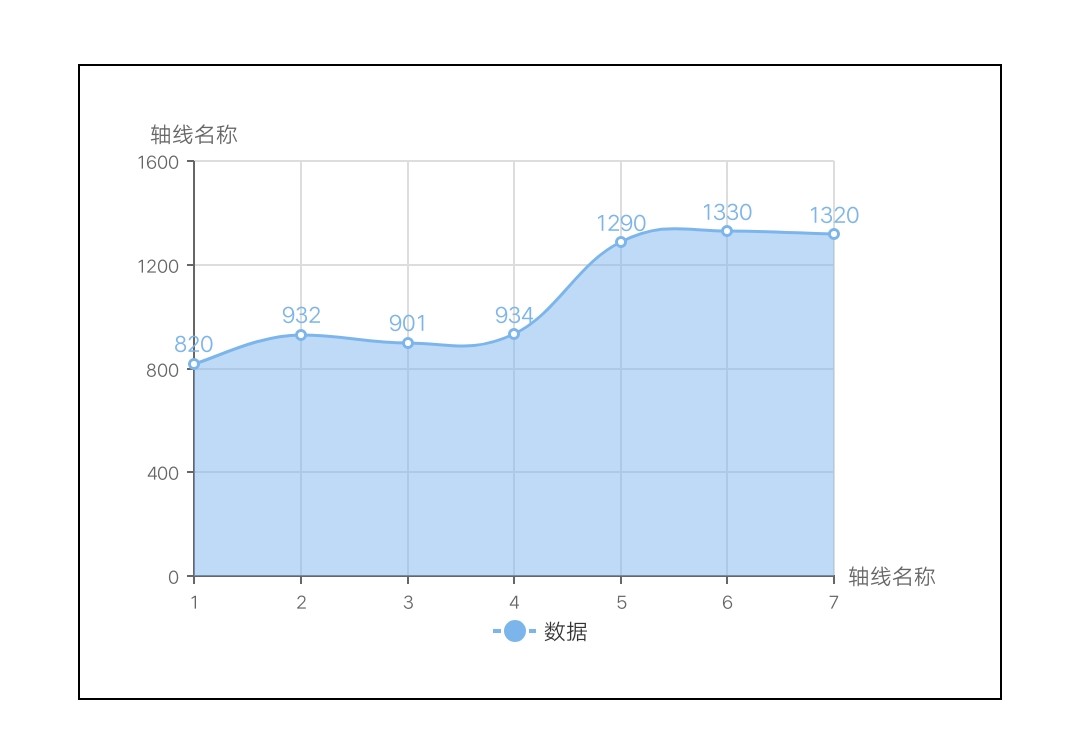
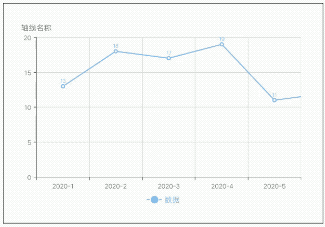
- 线图 line
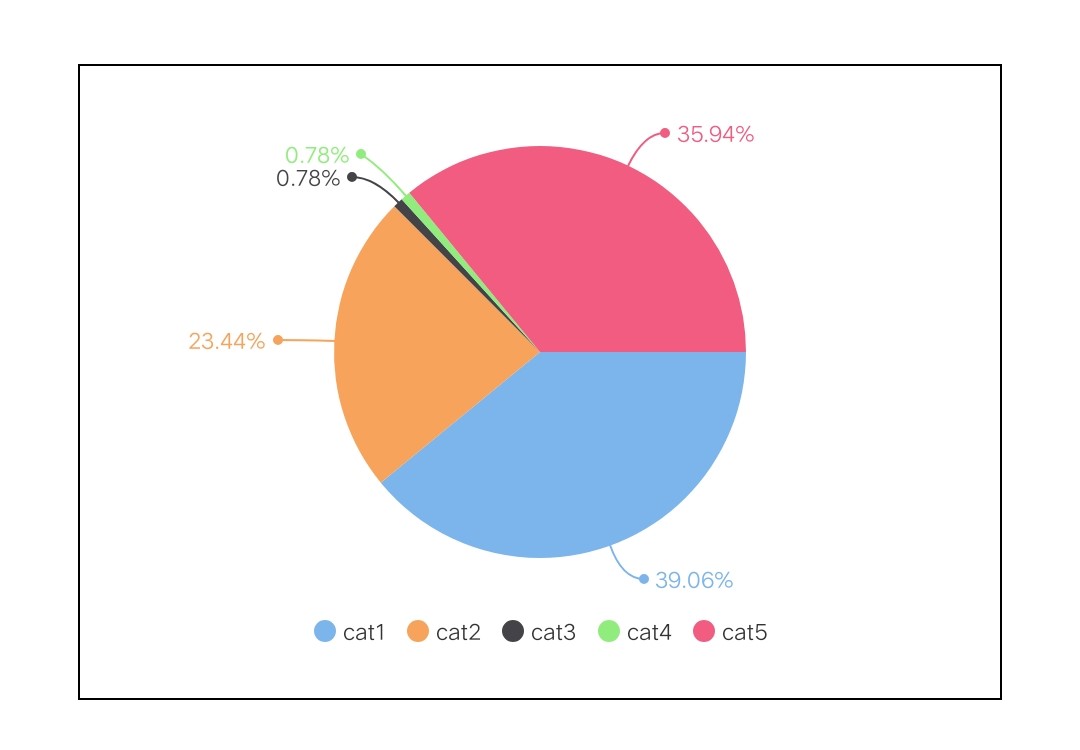
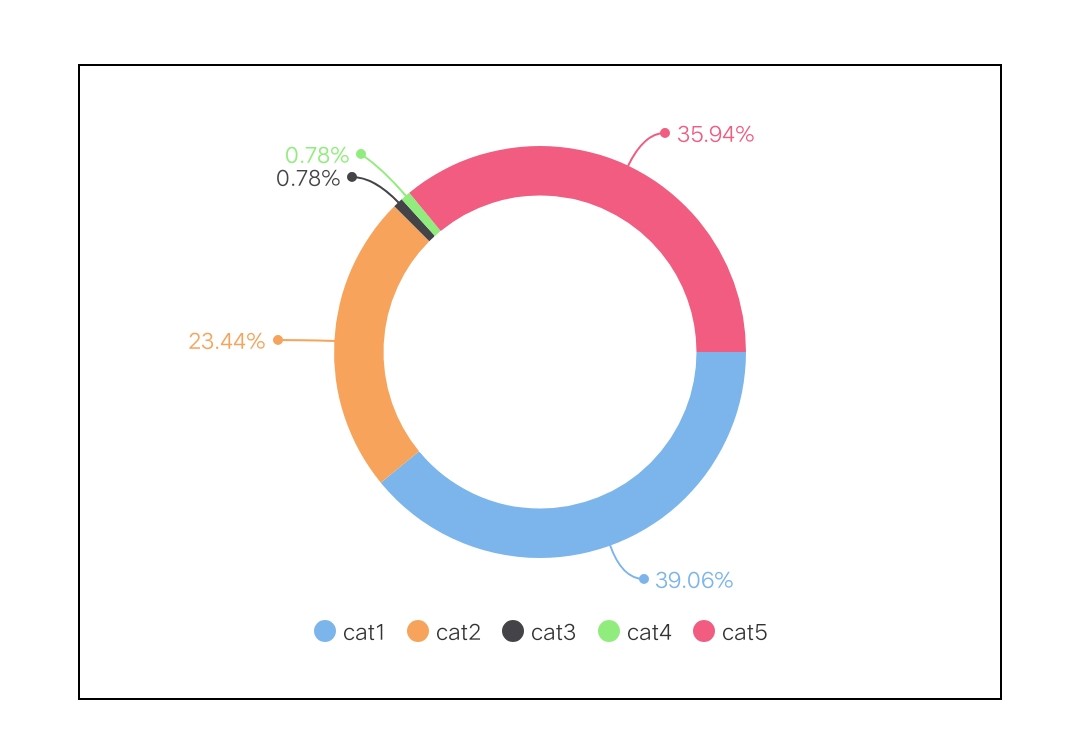
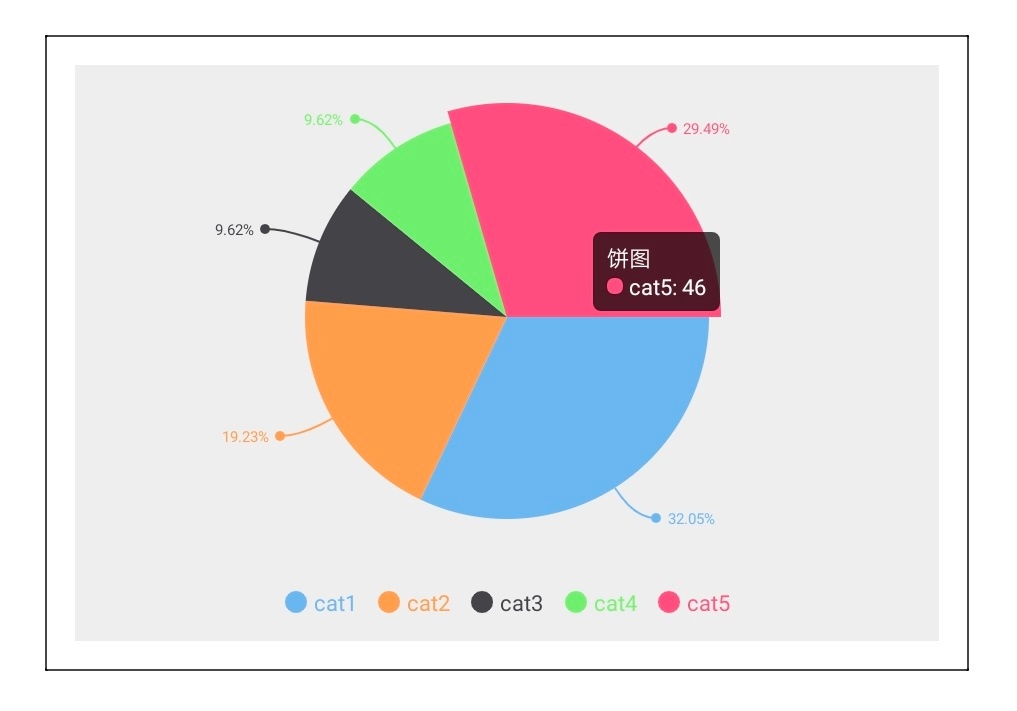
- 饼图 pie
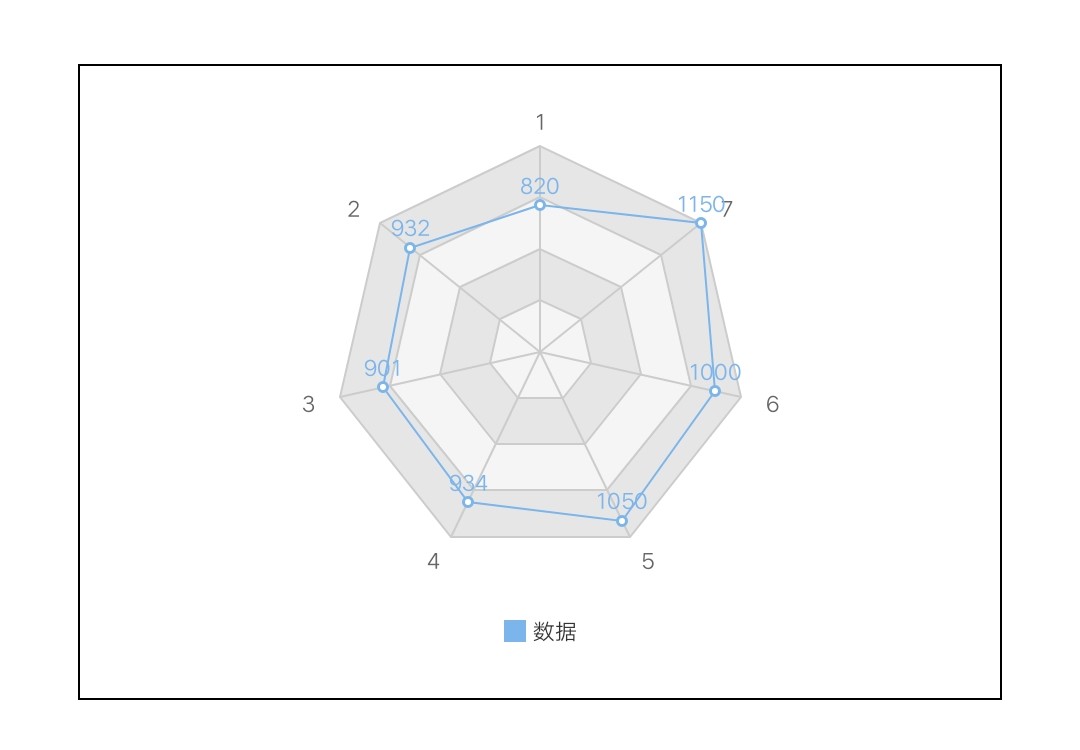
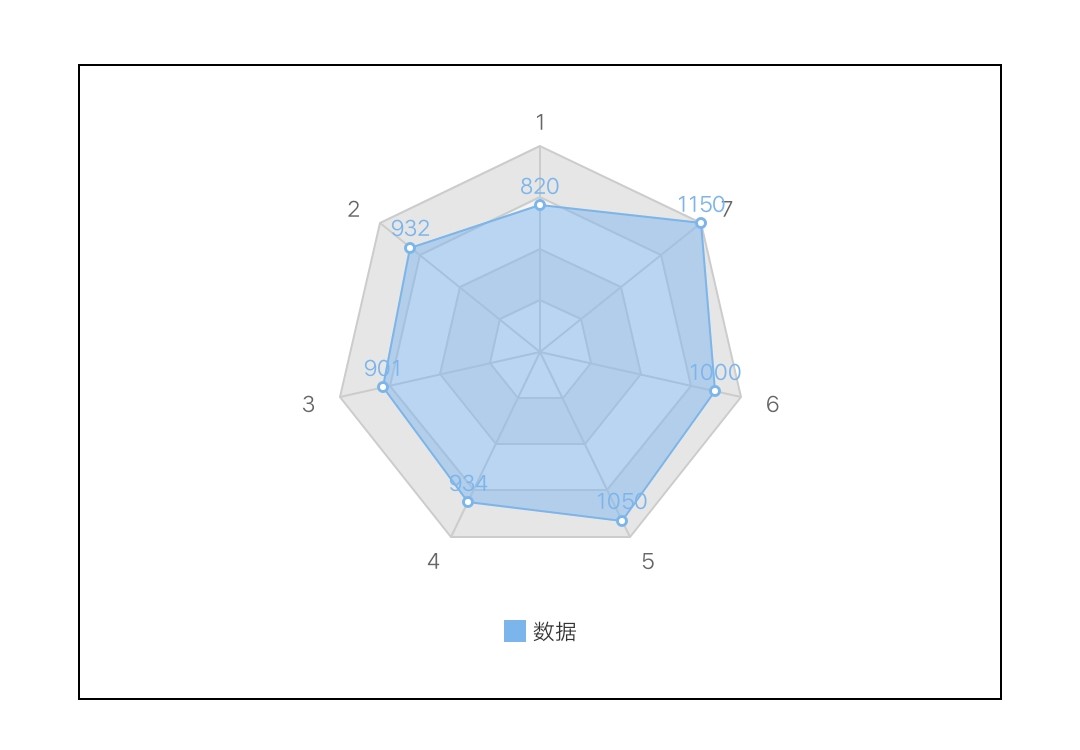
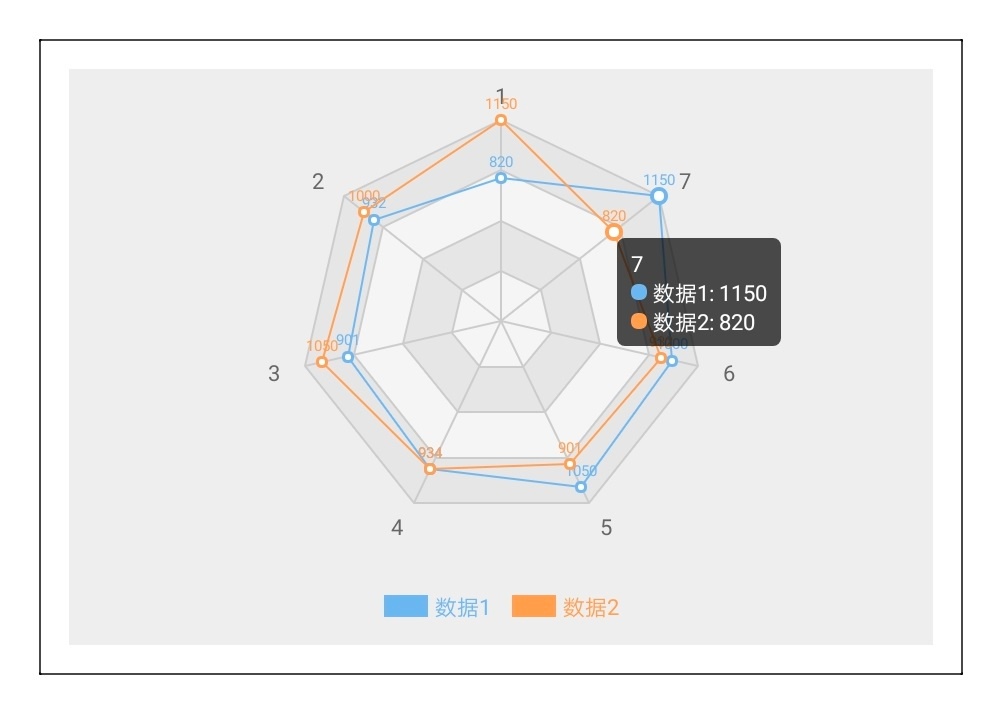
- 雷达图 radar
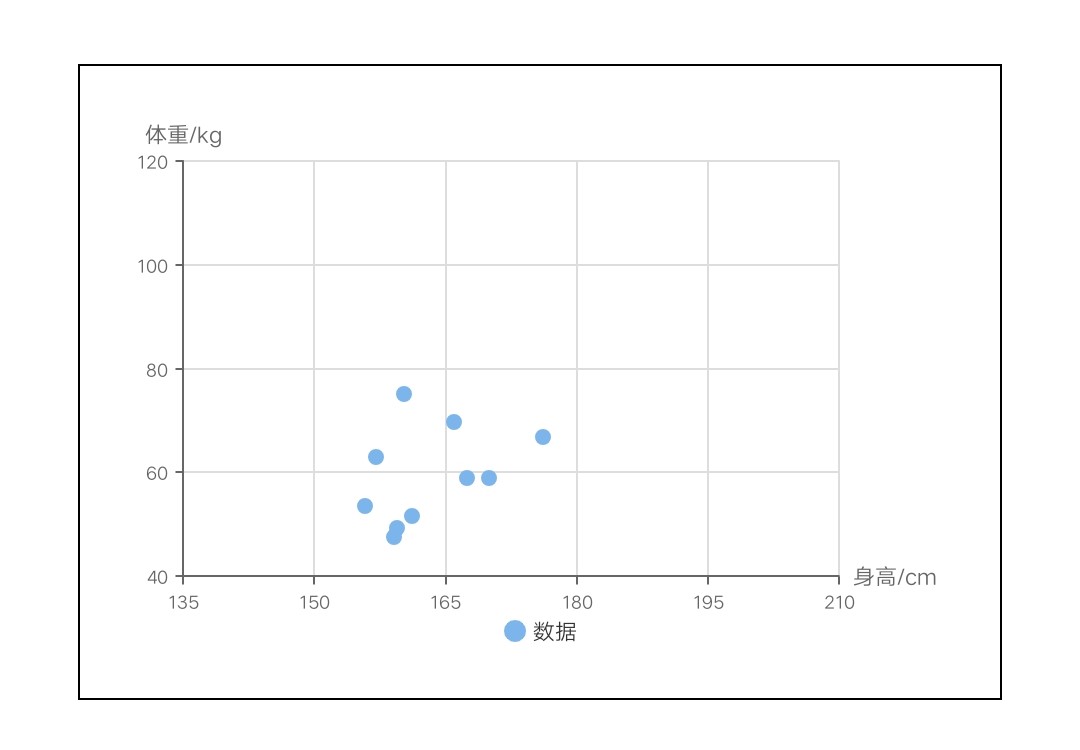
- 点图 scatter
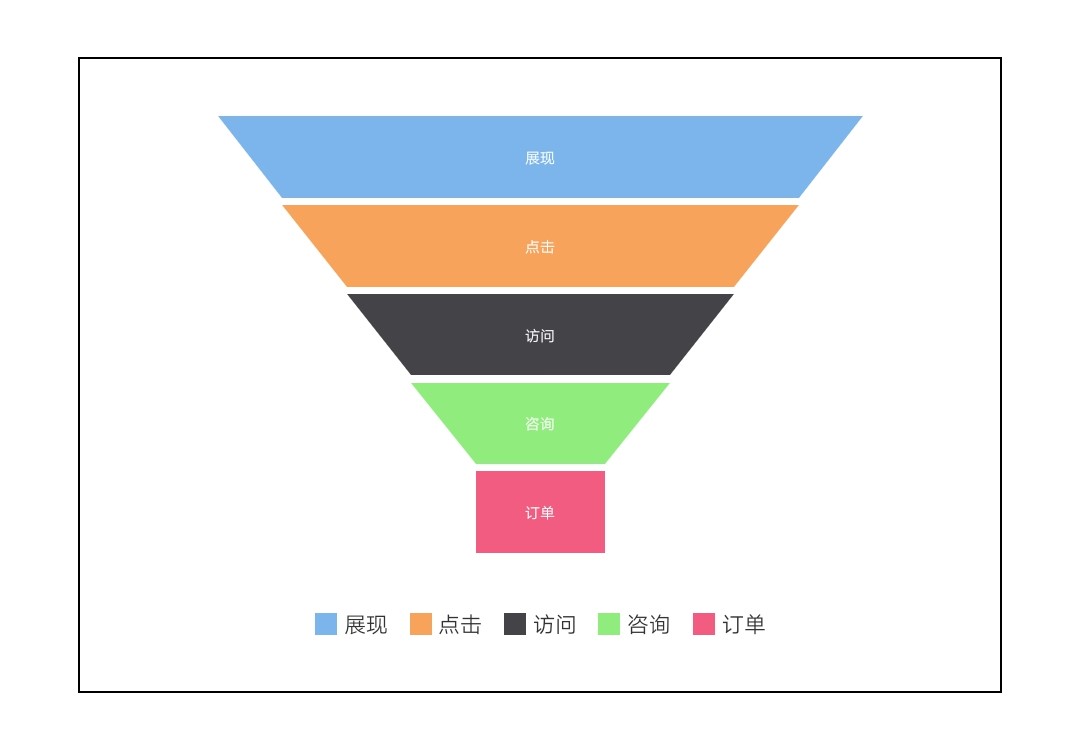
- 漏斗图/金字塔图 funnel
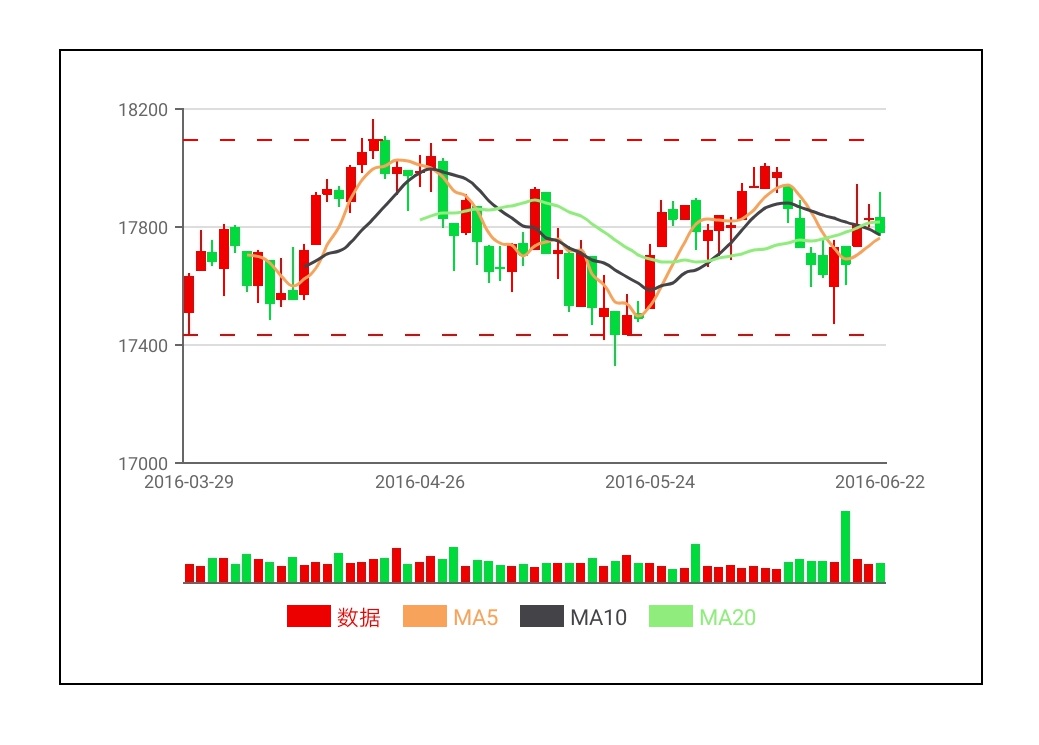
- 蜡烛图/K线图 candlestick/k
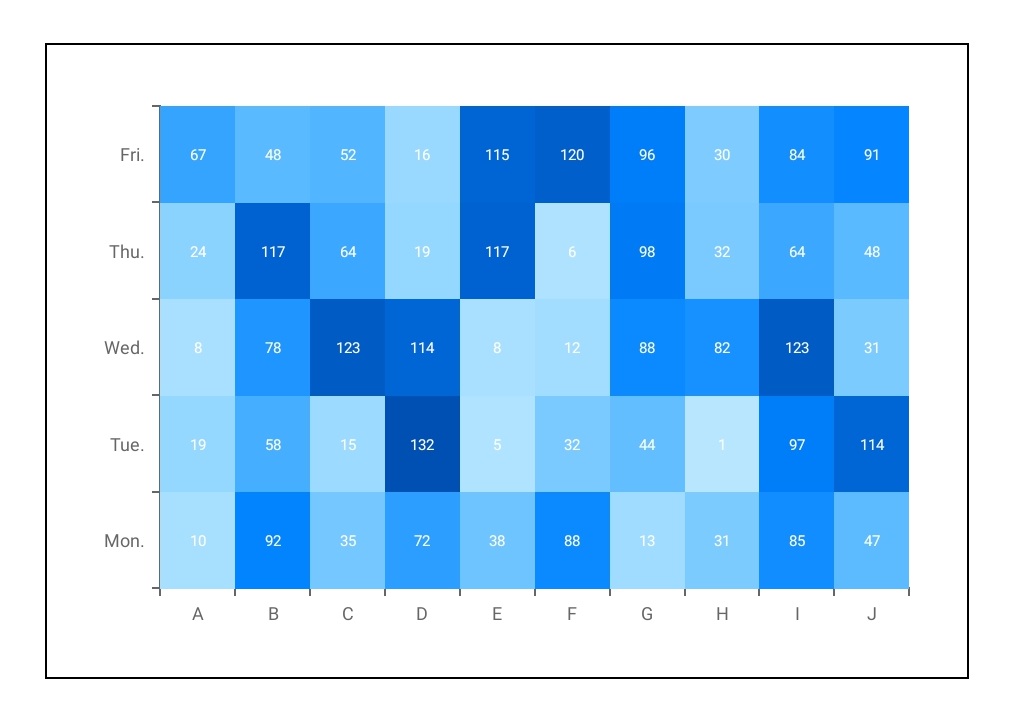
- 热力图 heatmap
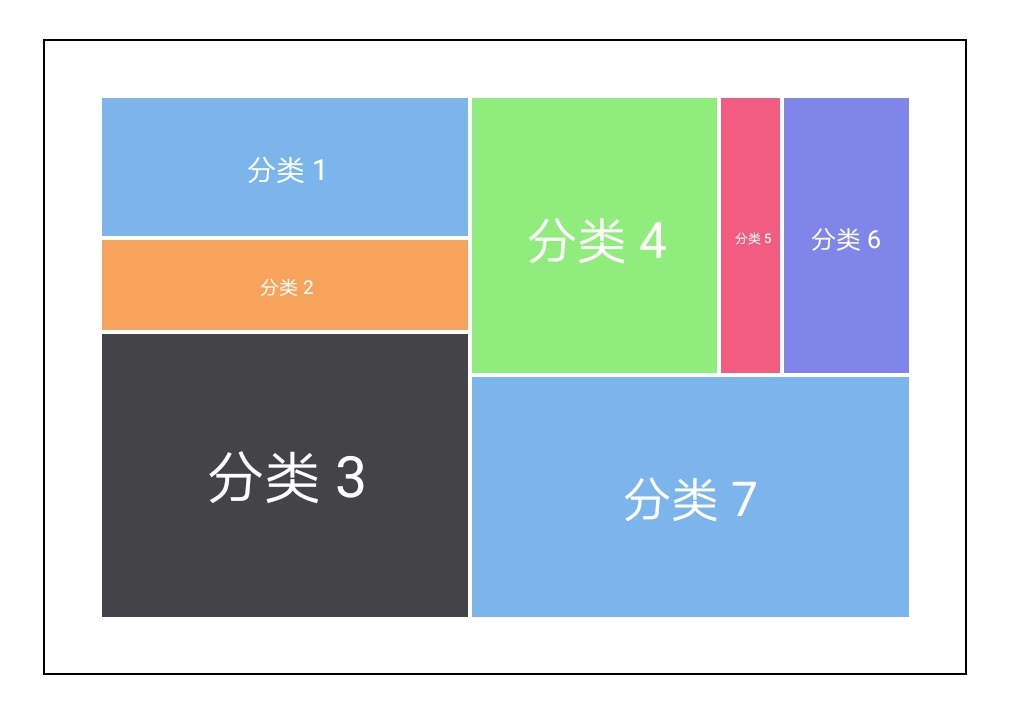
- 矩形树图 treemap
- 词云图 tagCloud
# 图表展示

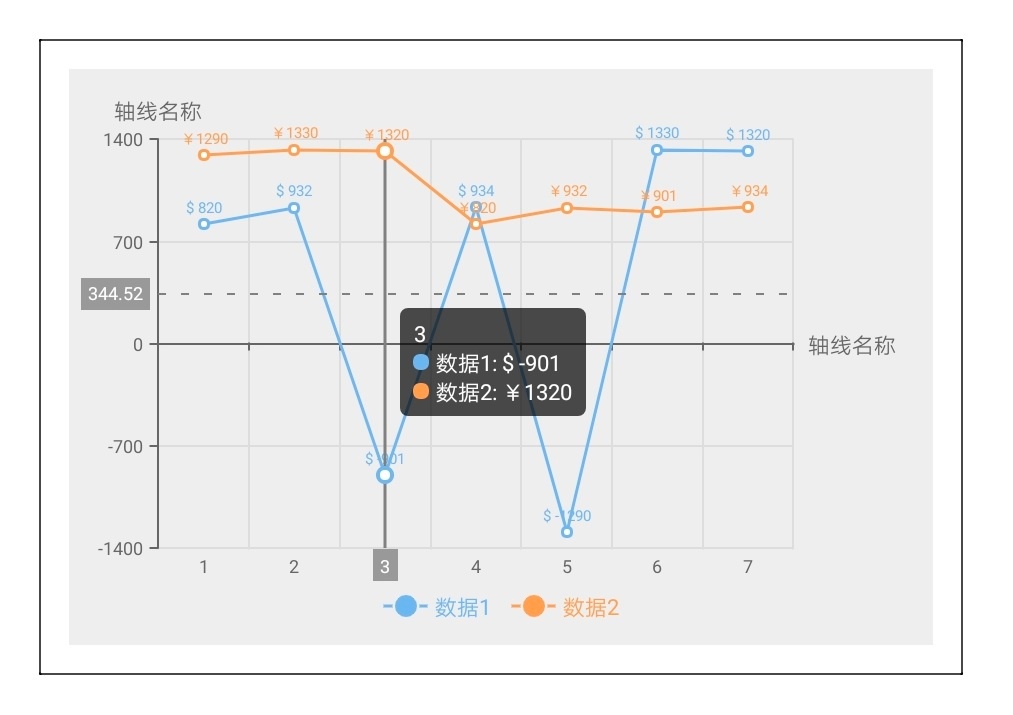
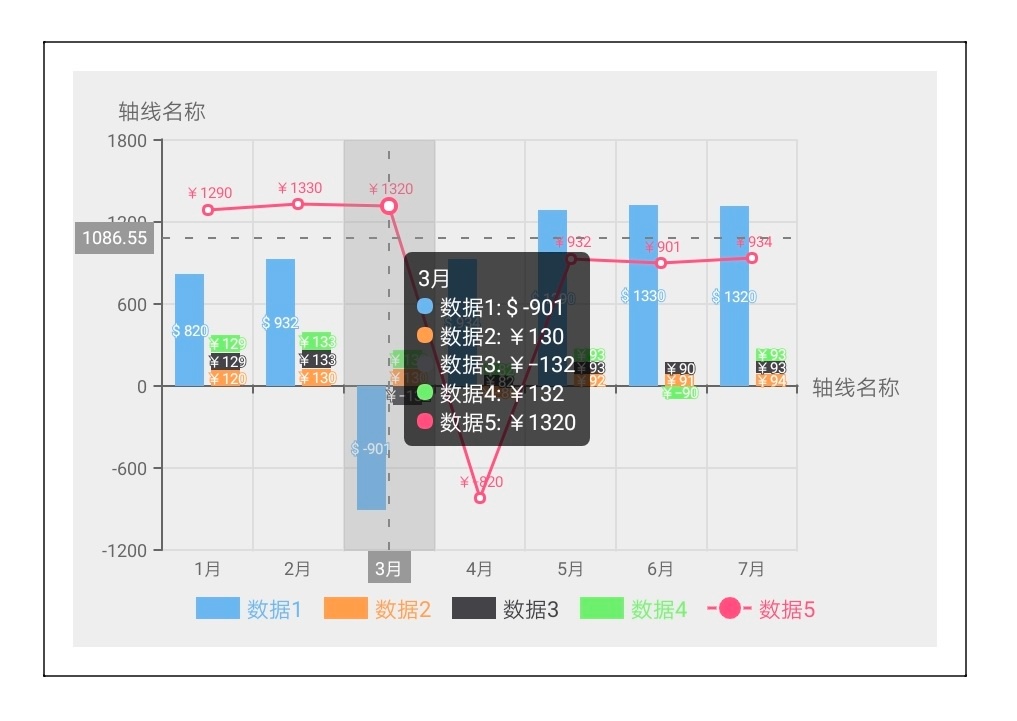
# tooltip展示
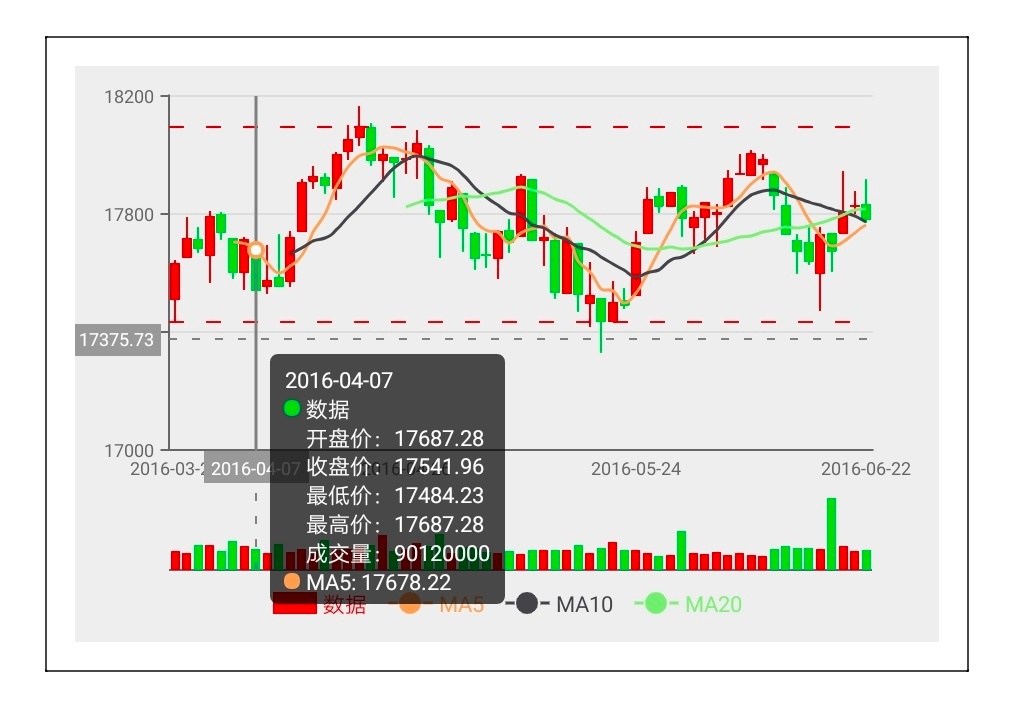
# 滑动图表展示
# 使用方法
- 在 script 中引入方法
- 在 script 定义变量保存 Charts 实例,为避免堆栈溢出问题,请勿赋值给成员变量,参考 快应用文档 (opens new window)
- 定义图表绘制方法, 如果一个页面内存在多个图表会导致图表动画失效,可以使用 async, await 同步绘制各个图表,保证正常动画效果
- 初始化图表方法只能在 onShow 生命周期调用
<script>
  import Charts from "apex-ui/components/charts/qacharts-min.js";

  let $chart1, $chart2;

  export default {
    async onShow() {
      await this.initChart1();
      await this.initChart2();
    },
    initChart1() {
      return new Promise((resolve, reject) => {
        $chart1 = new Charts({
          ...
          ...
          ...
          onRenderComplete: () => {
            console.log('chart1 renderComplete')
            resolve()
          },
        })
      })
    },
    initChart2() {
      return new Promise((resolve, reject) => {
        $chart2 = new Charts({
          ...
          ...
          ...
          onRenderComplete: () => {
            console.log('chart2 renderComplete')
            resolve()
          },
        })
      })
    },
  };
</script>
1
2
3
4
5
6
7
8
9
10
11
12
13
14
15
16
17
18
19
20
21
22
23
24
25
26
27
28
29
30
31
32
33
34
35
36
37
38
2
3
4
5
6
7
8
9
10
11
12
13
14
15
16
17
18
19
20
21
22
23
24
25
26
27
28
29
30
31
32
33
34
35
36
37
38