# 热力图 heatmap
# 热力图
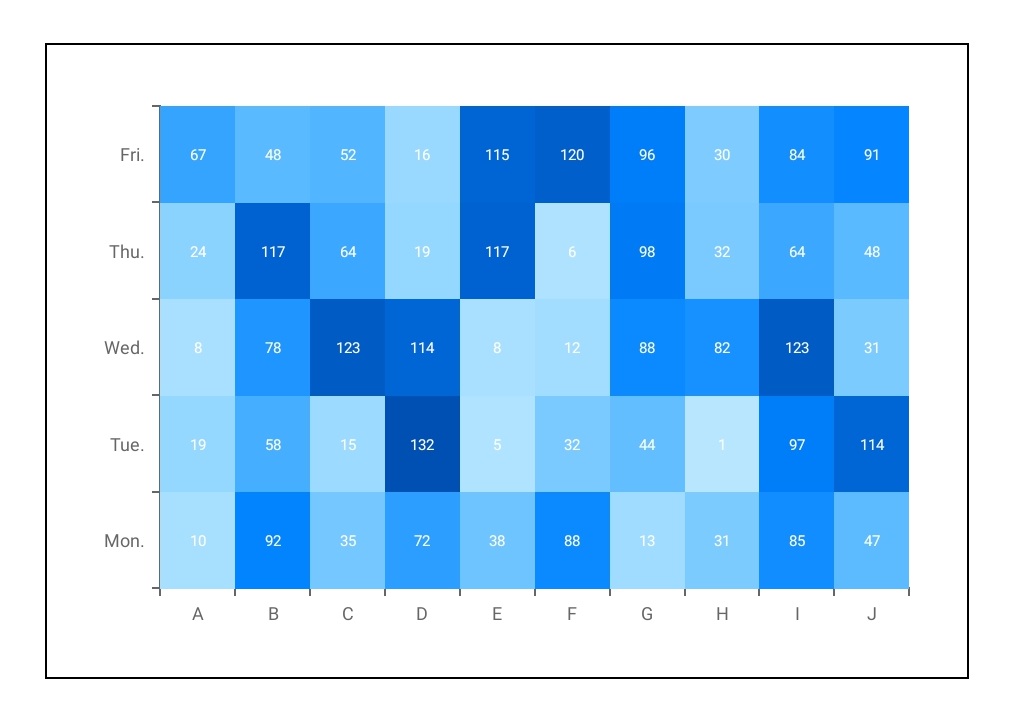
# 示例代码
<template>
  <div class="chart-wrap">
    <canvas
      id="chart"
      style="width: {{width}}px; height: {{height}}px;"
    ></canvas>
  </div>
</template>

<script>
  import Charts from "apex-ui/components/charts/qacharts-min.js";

  let $chart = null;

  export default {
    props: {
      width: {
        default: 600
      },
      height: {
        default: 400
      }
    },
    data() {
      return {};
    },
    initChart() {
      $chart = new Charts({
        element: this.$element("chart"),
        width: this.width,
        height: this.height,
        label: {
          show: true
        },
        yAxis: {
          type: "category",
          data: ["Mon.", "Tue.", "Wed.", "Thu.", "Fri."],
          axisSplitLine: {
            show: false
          }
        },
        xAxis: {
          type: "category",
          data: ["A", "B", "C", "D", "E", "F", "G", "H", "I", "J"],
          axisSplitLine: {
            show: false
          }
        },
        series: [
          {
            name: "热力图",
            type: "heatmap",
            data: [
              [0, 0, 10],
              [0, 1, 19],
              [0, 2, 8],
              [0, 3, 24],
              [0, 4, 67],
              [1, 0, 92],
              [1, 1, 58],
              [1, 2, 78],
              [1, 3, 117],
              [1, 4, 48],
              [2, 0, 35],
              [2, 1, 15],
              [2, 2, 123],
              [2, 3, 64],
              [2, 4, 52],
              [3, 0, 72],
              [3, 1, 132],
              [3, 2, 114],
              [3, 3, 19],
              [3, 4, 16],
              [4, 0, 38],
              [4, 1, 5],
              [4, 2, 8],
              [4, 3, 117],
              [4, 4, 115],
              [5, 0, 88],
              [5, 1, 32],
              [5, 2, 12],
              [5, 3, 6],
              [5, 4, 120],
              [6, 0, 13],
              [6, 1, 44],
              [6, 2, 88],
              [6, 3, 98],
              [6, 4, 96],
              [7, 0, 31],
              [7, 1, 1],
              [7, 2, 82],
              [7, 3, 32],
              [7, 4, 30],
              [8, 0, 85],
              [8, 1, 97],
              [8, 2, 123],
              [8, 3, 64],
              [8, 4, 84],
              [9, 0, 47],
              [9, 1, 114],
              [9, 2, 31],
              [9, 3, 48],
              [9, 4, 91]
            ],
            itemStyle: {
              color: ["#BAE7FF", "#0050B3"],
              useSplit: false
            }
          }
        ],
        onRenderComplete: () => {
          console.log("chartHeatmap renderComplete");
        }
      });
    }
  };
</script>
1
2
3
4
5
6
7
8
9
10
11
12
13
14
15
16
17
18
19
20
21
22
23
24
25
26
27
28
29
30
31
32
33
34
35
36
37
38
39
40
41
42
43
44
45
46
47
48
49
50
51
52
53
54
55
56
57
58
59
60
61
62
63
64
65
66
67
68
69
70
71
72
73
74
75
76
77
78
79
80
81
82
83
84
85
86
87
88
89
90
91
92
93
94
95
96
97
98
99
100
101
102
103
104
105
106
107
108
109
110
111
112
113
114
115
116
117