# 雷达图 Radar
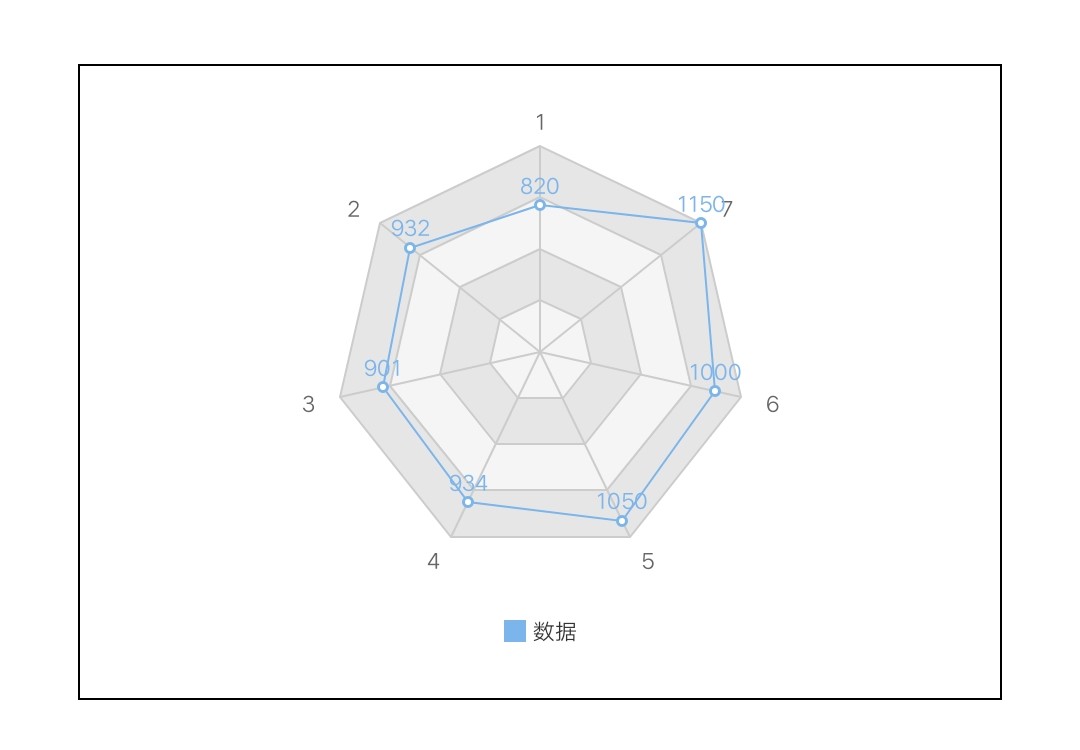
# 基础雷达图
# 示例代码
<template>
  <div class="chart-wrap">
    <canvas id="chart" style="width: {{width}}px; height: {{height}}px;"></canvas>
  </div>
</template>

<script>
  import Charts from "apex-ui/components/charts/qacharts-min.js";

  let $chart;

  export default {
    props: {
      width: {
        default: 600,
      },
      height: {
        default: 400,
      },
    },
    data() {
      return {};
    },
    initChart() {
      $chart = new Charts({
        element: this.$element("chart"),
        width: this.width,
        height: this.height,
        category: [1,2,3,4,5,6,7]
        series: [
          {
            name: "数据",
            type: "radar",
            data: [820, 932, 901, 934, 1290, 1330, 1320]
          }
        ],
        onRenderComplete: () => {
          console.log("chartRadar renderComplete");
        }
      });
    }
  };
</script>
1
2
3
4
5
6
7
8
9
10
11
12
13
14
15
16
17
18
19
20
21
22
23
24
25
26
27
28
29
30
31
32
33
34
35
36
37
38
39
40
41
42
43
2
3
4
5
6
7
8
9
10
11
12
13
14
15
16
17
18
19
20
21
22
23
24
25
26
27
28
29
30
31
32
33
34
35
36
37
38
39
40
41
42
43
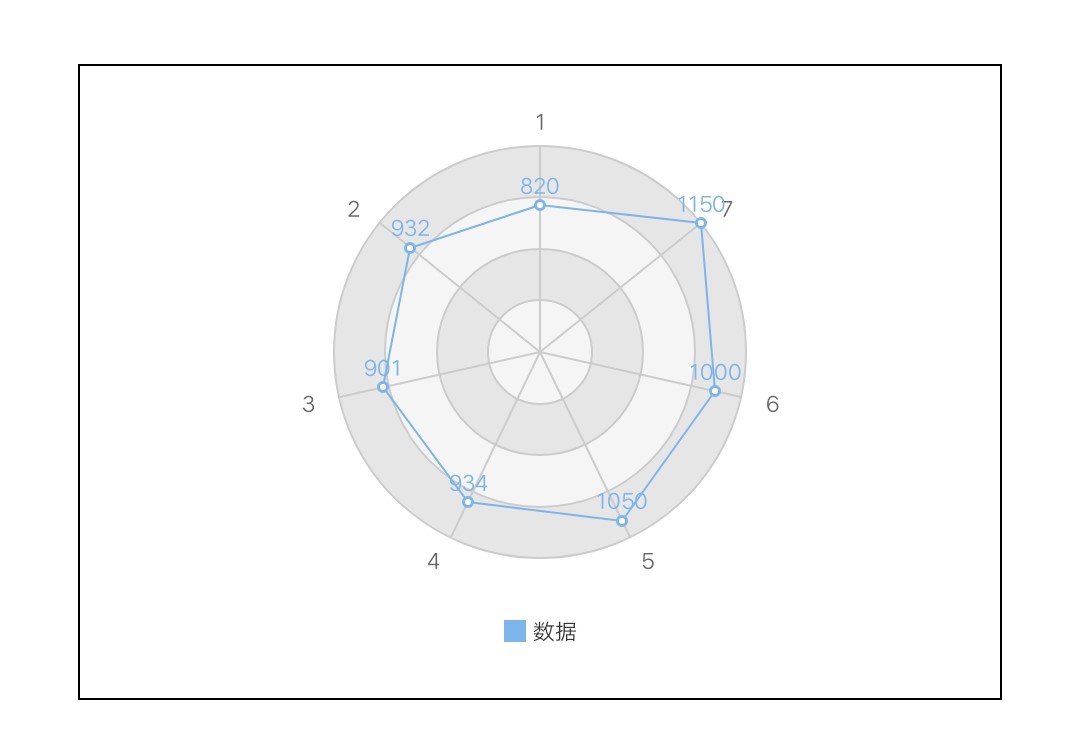
# 圆形面积图
# 示例代码
<template>
  <div class="chart-wrap">
    <canvas id="chart" style="width: {{width}}px; height: {{height}}px;"></canvas>
  </div>
</template>

<script>
  import Charts from "apex-ui/components/charts/qacharts-min.js";

  let $chart;

  export default {
    props: {
      width: {
        default: 600,
      },
      height: {
        default: 400,
      },
    },
    data() {
      return {};
    },
    initChart() {
      $chart = new Charts({
        element: this.$element("chart"),
        width: this.width,
        height: this.height,
        radarAxis: {
          shape: 'circle'
        },
        category: [1,2,3,4,5,6,7]
        series: [
          {
            name: "数据",
            type: "radar",
            data: [820, 932, 901, 934, 1290, 1330, 1320],
            area: {
              show: true
            }
          }
        ],
        onRenderComplete: () => {
          console.log("chartRadar renderComplete");
        }
      });
    }
  };
</script>
1
2
3
4
5
6
7
8
9
10
11
12
13
14
15
16
17
18
19
20
21
22
23
24
25
26
27
28
29
30
31
32
33
34
35
36
37
38
39
40
41
42
43
44
45
46
47
48
49
2
3
4
5
6
7
8
9
10
11
12
13
14
15
16
17
18
19
20
21
22
23
24
25
26
27
28
29
30
31
32
33
34
35
36
37
38
39
40
41
42
43
44
45
46
47
48
49
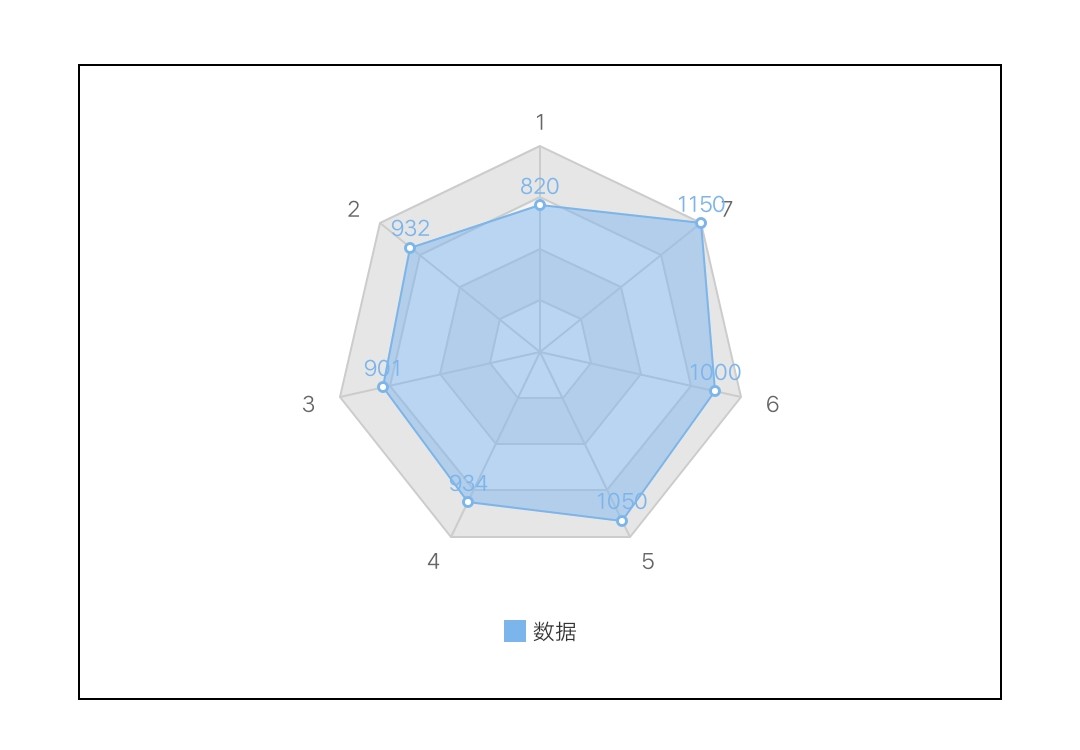
# 雷达面积图
# 示例代码
<template>
  <div class="chart-wrap">
    <canvas id="chart" style="width: {{width}}px; height: {{height}}px;"></canvas>
  </div>
</template>

<script>
  import Charts from "apex-ui/components/charts/qacharts-min.js";

  let $chart;

  export default {
    props: {
      width: {
        default: 600,
      },
      height: {
        default: 400,
      },
    },
    data() {
      return {};
    },
    initChart() {
      $chart = new Charts({
        element: this.$element("chart"),
        width: this.width,
        height: this.height,
        category: [1,2,3,4,5,6,7]
        series: [
          {
            name: "数据",
            type: "radar",
            data: [820, 932, 901, 934, 1290, 1330, 1320],
            area: {
              show: true
            }
          }
        ],
        onRenderComplete: () => {
          console.log("chartRadar renderComplete");
        }
      });
    }
  };
</script>
1
2
3
4
5
6
7
8
9
10
11
12
13
14
15
16
17
18
19
20
21
22
23
24
25
26
27
28
29
30
31
32
33
34
35
36
37
38
39
40
41
42
43
44
45
46
2
3
4
5
6
7
8
9
10
11
12
13
14
15
16
17
18
19
20
21
22
23
24
25
26
27
28
29
30
31
32
33
34
35
36
37
38
39
40
41
42
43
44
45
46
← 饼图 pie 点图 scatter →