# 词云图 tagCloud
# 词云图
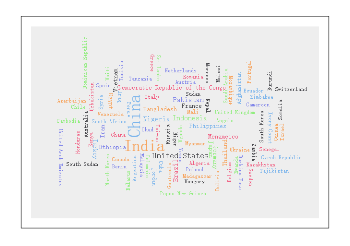
# 示例代码
<template>
  <div class="chart-wrap">
    <canvas
      id="chart"
      style="width: {{width}}px; height: {{height}}px;"
    ></canvas>
    <canvas
      id="hideCharts"
      style="width: {{width}}px; height: {{height}}px;"
      show="{{false}}"
    ></canvas>
  </div>
</template>

<script>
  import Charts from "apex-ui/components/charts/qacharts-min.js";
  import worldPopulation from "./world-population.js";

  let $chart = null;

  export default {
    props: {
      width: {
        default: 600
      },
      height: {
        default: 400
      }
    },
    data() {
      return {};
    },
    initChart() {
      const range = worldPopulation.concat([]).sort((a, b) => {
        return a.value - b.value;
      });
      const min = range[0].value;
      const max = range[range.length - 1].value;
      const MAX_FONTSIZE = 36; // 最大的字体
      const MIN_FONTSIZE = 12; // 最小的字体

      const fontSize = function fontSize(d) {
        if (d.value) {
          return ((d.value - min) / (max - min)) * (MAX_FONTSIZE - MIN_FONTSIZE) + MIN_FONTSIZE
        }
        return 0
      }

      const rotate = function rotate() {
        let random = ~~(Math.random() * 4) % 4
        if (random === 2) {
          random = 0
        }
        return random * 90 // 0, 90, 270
      }

      const data = worldPopulation.map(item => {
        item.size = fontSize(item)
        return { ...item }
      })

      $chart = new Charts({
        element: this.$element("chart"),
        width: this.width,
        height: this.height,
        legend: {
          show: false
        },
        series: [
          {
            name: '词云图',
            type: 'tagCloud',
            canvas: this.$element('hideCanvas'),
            size: [this.width, this.height],
            font: 'Serif',
            fontSize,
            padding: 0,
            rotate,
            spiral: 'archimedean',
            timeInterval: 5000,
            data,
          }
        ],
        onRenderComplete: () => {
          console.log("chartTagCloud renderComplete");
        }
      });
    }
  };
</script>
1
2
3
4
5
6
7
8
9
10
11
12
13
14
15
16
17
18
19
20
21
22
23
24
25
26
27
28
29
30
31
32
33
34
35
36
37
38
39
40
41
42
43
44
45
46
47
48
49
50
51
52
53
54
55
56
57
58
59
60
61
62
63
64
65
66
67
68
69
70
71
72
73
74
75
76
77
78
79
80
81
82
83
84
85
86
87
88
89
90
2
3
4
5
6
7
8
9
10
11
12
13
14
15
16
17
18
19
20
21
22
23
24
25
26
27
28
29
30
31
32
33
34
35
36
37
38
39
40
41
42
43
44
45
46
47
48
49
50
51
52
53
54
55
56
57
58
59
60
61
62
63
64
65
66
67
68
69
70
71
72
73
74
75
76
77
78
79
80
81
82
83
84
85
86
87
88
89
90
← 矩形树图 treemap 方法 →