# 柱状图 bar
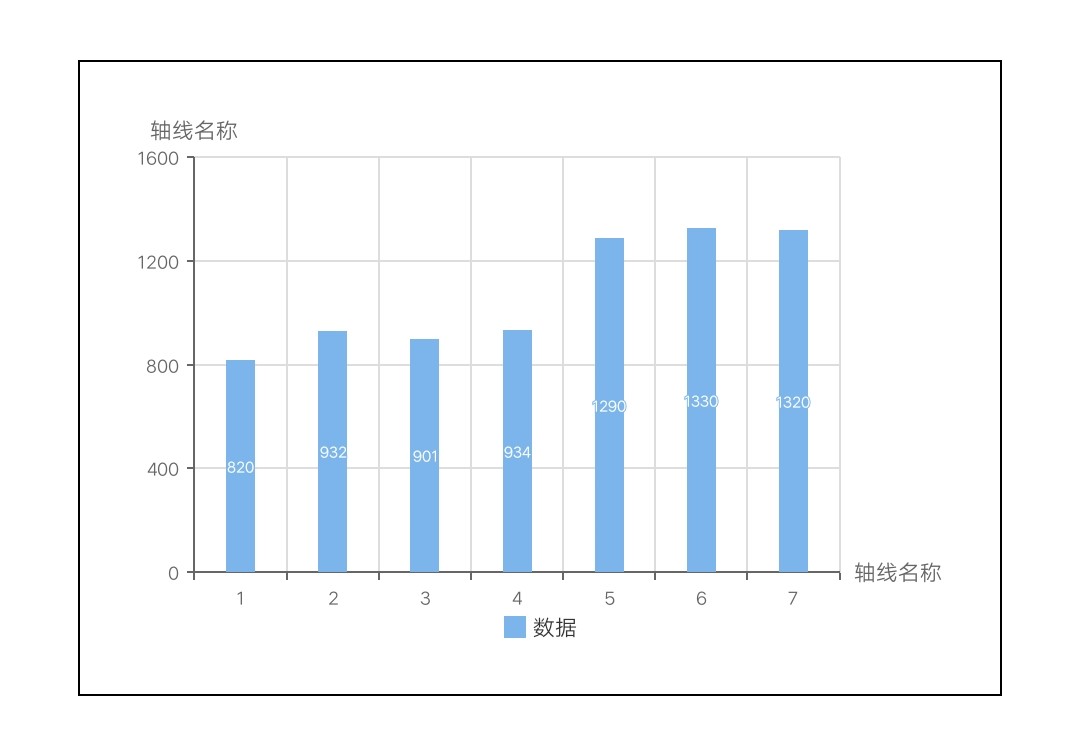
# 基础柱状图
# 示例代码
<template>
  <div class="chart-wrap">
    <canvas id="chart" style="width: {{width}}px; height: {{height}}px;"></canvas>
  </div>
</template>

<script>
  import Charts from 'apex-ui/components/charts/qacharts-min.js'

  let $chart

  export default {
    props: {
      width: {
        default: 600,
      },
      height: {
        default: 400,
      },
    },
    data() {
      return {}
    },
    initChart() {
      $chart = new Charts({
        element: this.$element('chart'),
        width: this.width,
        height: this.height,
        xAxis: {
          type: 'category',
          data: ['1', '2', '3', '4', '5', '6', '7'],
        },
        series: [
          {
            name: '数据',
            type: 'bar',
            data: [820, 932, 901, 934, 1290, 1330, 1320],
          },
        ],
        onRenderComplete: () => {
          console.log('chartBar renderComplete')
        },
      })
    },
  }
</script>
1
2
3
4
5
6
7
8
9
10
11
12
13
14
15
16
17
18
19
20
21
22
23
24
25
26
27
28
29
30
31
32
33
34
35
36
37
38
39
40
41
42
43
44
45
46
2
3
4
5
6
7
8
9
10
11
12
13
14
15
16
17
18
19
20
21
22
23
24
25
26
27
28
29
30
31
32
33
34
35
36
37
38
39
40
41
42
43
44
45
46
# 示例代码
<template>
<div class="chart-wrap">
<canvas id="chart" style="width: {{width}}px; height: {{height}}px;"></canvas>
</div>
</template>
<script>
import Charts from 'apex-ui/components/charts/qacharts-min.js'
let $chart
export default {
props: {
width: {
default: 600,
},
height: {
default: 400,
},
},
data() {
return {}
},
initChart() {
$chart = new Charts({
element: this.$element('chart'),
width: this.width,
height: this.height,
xAxis: {
type: 'category',
data: ['1', '2', '3', '4', '5', '6', '7'],
},
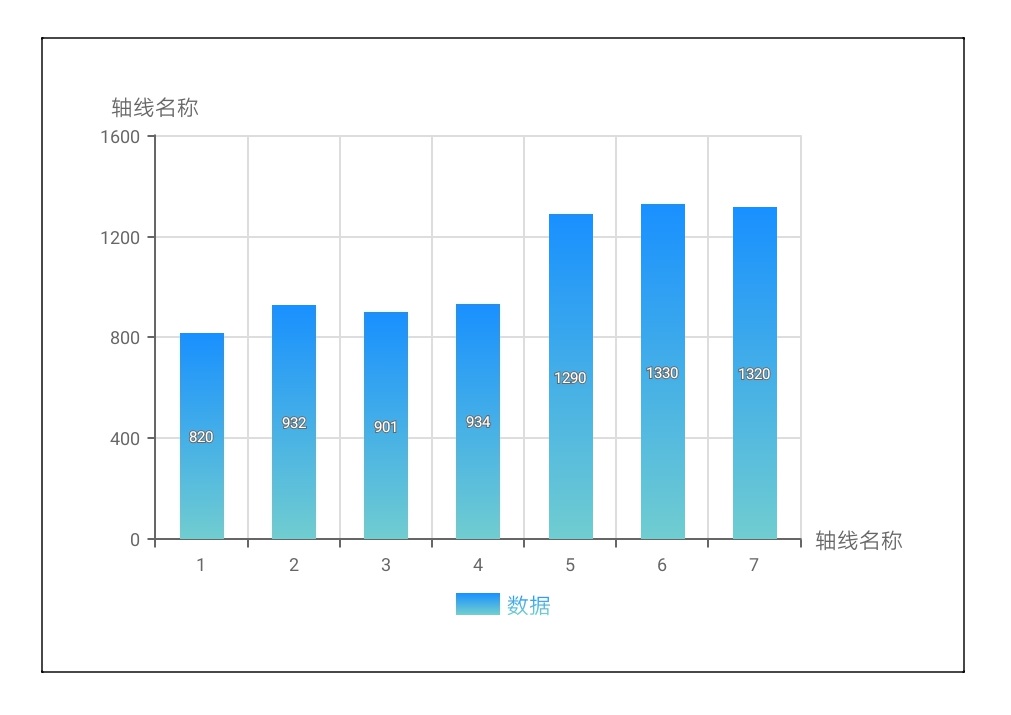
series: [
{
name: '数据',
type: 'bar',
barWidth: 30,
barMaxWidth: 100,
itemStyle: {
color: {
linearGradient: [0, 0, 0, 1],
colors: [
{ offset: 0, color: '#1890ff' },
{ offset: 1, color: '#70cdd0' },
],
},
},
data: [820, 932, 901, 934, 1290, 1330, 1320],
},
],
onRenderComplete: () => {
console.log('chartBar renderComplete')
},
})
},
}
</script>
1
2
3
4
5
6
7
8
9
10
11
12
13
14
15
16
17
18
19
20
21
22
23
24
25
26
27
28
29
30
31
32
33
34
35
36
37
38
39
40
41
42
43
44
45
46
47
48
49
50
51
52
53
54
55
56
57
2
3
4
5
6
7
8
9
10
11
12
13
14
15
16
17
18
19
20
21
22
23
24
25
26
27
28
29
30
31
32
33
34
35
36
37
38
39
40
41
42
43
44
45
46
47
48
49
50
51
52
53
54
55
56
57
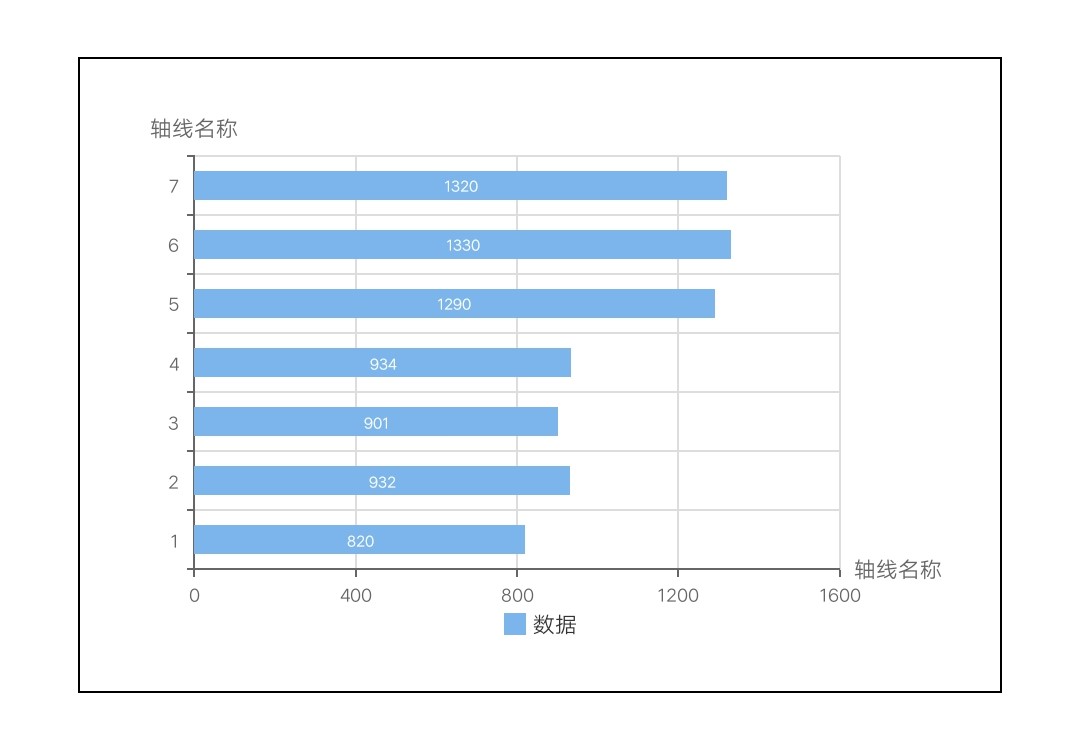
# 条形图
# 示例代码
<template>
  <div class="chart-wrap">
    <canvas id="chart" style="width: {{width}}px; height: {{height}}px;"></canvas>
  </div>
</template>

<script>
  import Charts from 'apex-ui/components/charts/qacharts-min.js'

  let $chart

  export default {
    props: {
      width: {
        default: 600,
      },
      height: {
        default: 400,
      },
    },
    data() {
      return {}
    },
    initChart() {
      $chart = new Charts({
        element: this.$element('chart'),
        width: this.width,
        height: this.height,
        yAxis: {
          type: 'category',
          data: ['1', '2', '3', '4', '5', '6', '7'],
        },
        xAxis: {
          type: 'value',
        },
        series: [
          {
            name: '数据',
            type: 'bar',
            data: [820, 932, 901, 934, 1290, 1330, 1320],
          },
        ],
        onRenderComplete: () => {
          console.log('chartBar renderComplete')
        },
      })
    },
  }
</script>
1
2
3
4
5
6
7
8
9
10
11
12
13
14
15
16
17
18
19
20
21
22
23
24
25
26
27
28
29
30
31
32
33
34
35
36
37
38
39
40
41
42
43
44
45
46
47
48
49
2
3
4
5
6
7
8
9
10
11
12
13
14
15
16
17
18
19
20
21
22
23
24
25
26
27
28
29
30
31
32
33
34
35
36
37
38
39
40
41
42
43
44
45
46
47
48
49
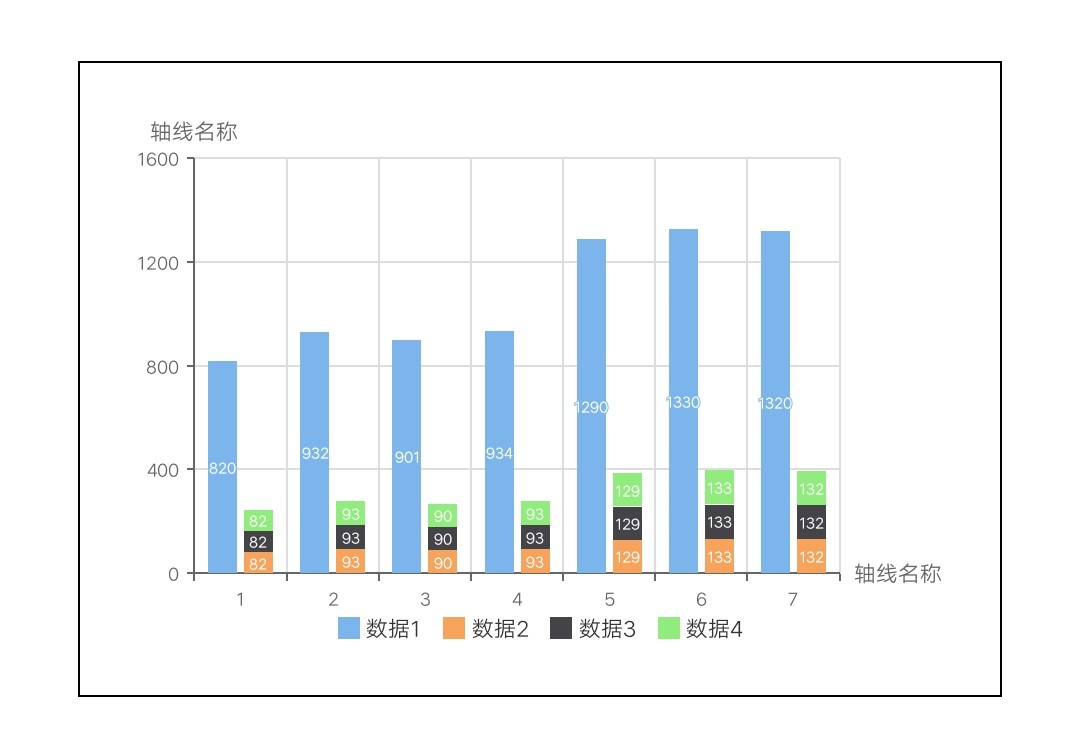
# 层叠柱状图
# 示例代码
<template>
  <div class="chart-wrap">
    <canvas id="chart" style="width: {{width}}px; height: {{height}}px;"></canvas>
  </div>
</template>

<script>
  import Charts from 'apex-ui/components/charts/qacharts-min.js'

  let $chart

  export default {
    props: {
      width: {
        default: 600,
      },
      height: {
        default: 400,
      },
    },
    data() {
      return {}
    },
    initChart() {
      $chart = new Charts({
        element: this.$element('chart'),
        type: 'bar',
        width: this.width,
        height: this.height,
        yAxis: {
          type: 'category',
          data: ['1', '2', '3', '4', '5', '6', '7'],
        },
        xAxis: {
          type: 'value',
        },
        series: [
          {
            name: '数据1',
            data: [820, 932, 901, 934, 1290, 1330, 1320],
          },
          {
            name: '数据2',
            stack: '层叠数据',
            data: [82, 93, 90, 93, 129, 133, 132],
          },
          {
            name: '数据3',
            stack: '层叠数据',
            data: [82, 93, 90, 93, 129, 133, 132],
          },
          {
            name: '数据4',
            stack: '层叠数据',
            data: [82, 93, 90, 93, 129, 133, 132],
          },
        ],
        onRenderComplete: () => {
          console.log('chartBar renderComplete')
        },
      })
    },
  }
</script>
1
2
3
4
5
6
7
8
9
10
11
12
13
14
15
16
17
18
19
20
21
22
23
24
25
26
27
28
29
30
31
32
33
34
35
36
37
38
39
40
41
42
43
44
45
46
47
48
49
50
51
52
53
54
55
56
57
58
59
60
61
62
63
64
2
3
4
5
6
7
8
9
10
11
12
13
14
15
16
17
18
19
20
21
22
23
24
25
26
27
28
29
30
31
32
33
34
35
36
37
38
39
40
41
42
43
44
45
46
47
48
49
50
51
52
53
54
55
56
57
58
59
60
61
62
63
64