# 饼图 pie
# 饼图
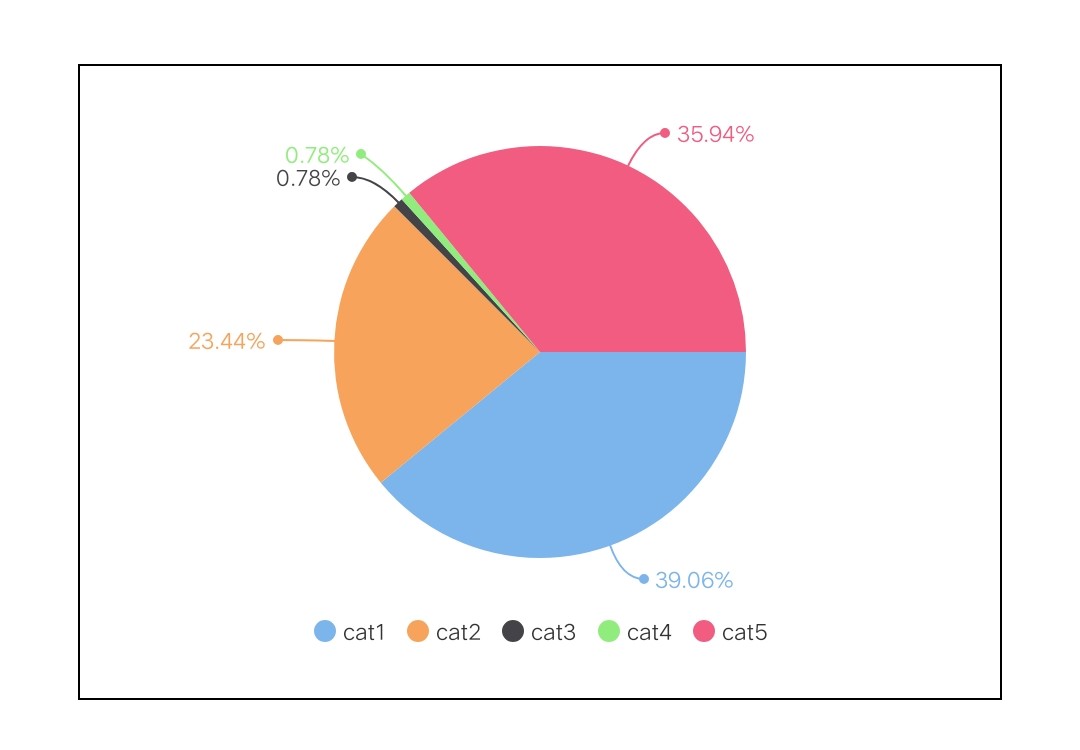
# 示例代码
<template>
  <div class="chart-wrap">
    <canvas id="chart" style="width: {{width}}px; height: {{height}}px;"></canvas>
  </div>
</template>

<script>
  import Charts from 'apex-ui/components/charts/qacharts-min.js'

  let $chart

  export default {
    props: {
      width: {
        default: 600,
      },
      height: {
        default: 400,
      },
    },
    data() {
      return {}
    },
    initChart() {
      $chart = new Charts({
        element: this.$element('chart'),
        width: this.width,
        height: this.height,
        series: [
          {
            name: "饼图",
            type: 'pie',
            data: [
              {
                name: 'cat1',
                value: 50,
              },
              {
                name: 'cat2',
                value: 30,
              },
              {
                name: 'cat3',
                value: 1,
              },
              {
                name: 'cat4',
                value: 1,
              },
              {
                name: 'cat5',
                value: 46,
              },
            ],
          },
        ],
        onRenderComplete: () => {
          console.log('chartPie renderComplete')
        },
      })
    },
  }
</script>
1
2
3
4
5
6
7
8
9
10
11
12
13
14
15
16
17
18
19
20
21
22
23
24
25
26
27
28
29
30
31
32
33
34
35
36
37
38
39
40
41
42
43
44
45
46
47
48
49
50
51
52
53
54
55
56
57
58
59
60
61
62
63
2
3
4
5
6
7
8
9
10
11
12
13
14
15
16
17
18
19
20
21
22
23
24
25
26
27
28
29
30
31
32
33
34
35
36
37
38
39
40
41
42
43
44
45
46
47
48
49
50
51
52
53
54
55
56
57
58
59
60
61
62
63
# 环形图
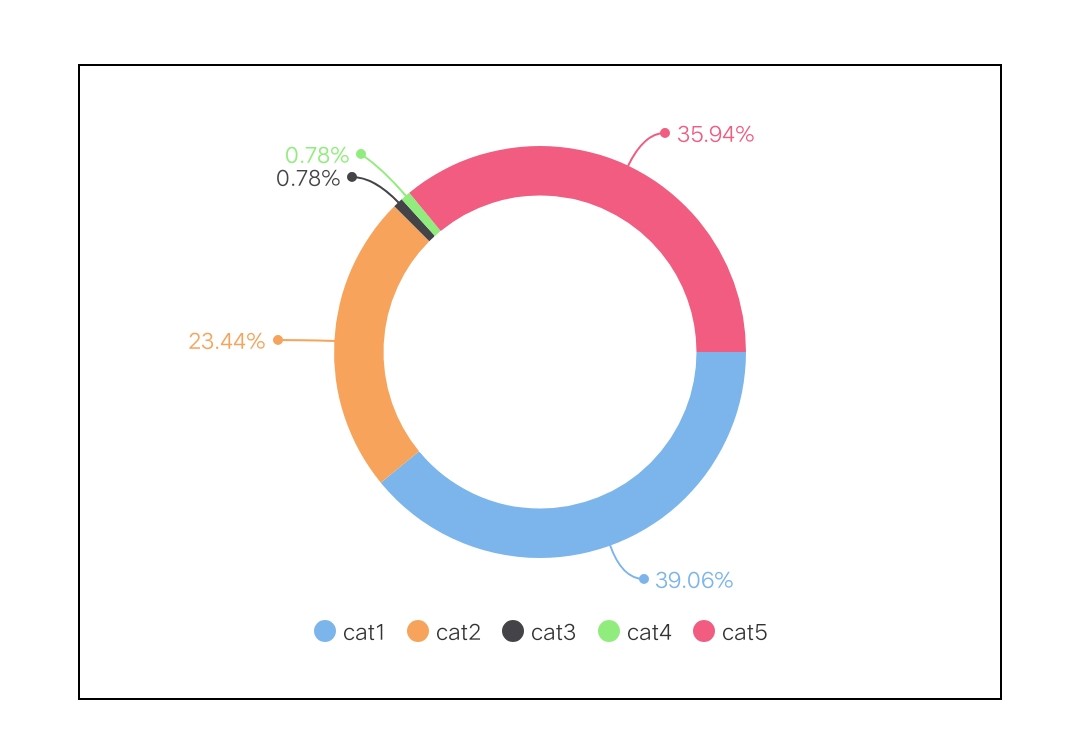
# 示例代码
<template>
  <div class="chart-wrap">
    <canvas id="chart" style="width: {{width}}px; height: {{height}}px;"></canvas>
  </div>
</template>

<script>
  import Charts from "apex-ui/components/charts/qacharts-min.js";

  let $chart;

  export default {
    props: {
      width: {
        default: 600,
      },
      height: {
        default: 400,
      },
    },
    data() {
      return {};
    },
    initChart() {
      $chart = new Charts({
        element: this.$element("chart"),
        type: "pie",
        width: this.width,
        height: this.height,
        series: [
          {
            radius: ['60%', '80%']
            data: [
              {
                name: 'cat1',
                value: 50,
              },
              {
                name: 'cat2',
                value: 30,
              },
              {
                name: 'cat3',
                value: 1,
              },
              {
                name: 'cat4',
                value: 1,
              },
              {
                name: 'cat5',
                value: 46,
              },
            ],
          }
        ],
        onRenderComplete: () => {
          console.log("chartPie renderComplete");
        }
      });
    }
  };
</script>
1
2
3
4
5
6
7
8
9
10
11
12
13
14
15
16
17
18
19
20
21
22
23
24
25
26
27
28
29
30
31
32
33
34
35
36
37
38
39
40
41
42
43
44
45
46
47
48
49
50
51
52
53
54
55
56
57
58
59
60
61
62
63
2
3
4
5
6
7
8
9
10
11
12
13
14
15
16
17
18
19
20
21
22
23
24
25
26
27
28
29
30
31
32
33
34
35
36
37
38
39
40
41
42
43
44
45
46
47
48
49
50
51
52
53
54
55
56
57
58
59
60
61
62
63